4 High-throughput biological experiments
Table of contents
- 4.1 One microarray experiment can detect thousands of gene expressions simultaneously
- 4.2 The next generation sequencing methods are faster and more cost-effective than Sanger sequencing
- 4.3 The second generation sequencing technologies can cover a wide range of applications
- 4.4 Liquid chromatography-tandem mass spectrometry is a powerful tool to analyze quantitative proteomics
- 4.5 Most preprocessed and raw data sets from high-throughput experiments are publicly available
- References
Emerging high-throughput technologies have enabled genome-wide analyses of various biological data, such as different cell lines, tissues, and species, under different conditions. This chapter explains several high-throughput technologies for transcriptomic and proteomic analyses used in our research. We used both microarray and quantitative proteomics data to achieve all three sub-goals, but we used next generation sequence data only for the second and third sub-goals: miRNA high-throughput experiments, and miRNA and other ncRNAs.
4.1 One microarray experiment can detect thousands of gene expressions simultaneously
Microarrays can capture the expression levels of many genes in a single set of experiments. The microarray technology enables a high-throughput transcriptome-wide analysis, which is hard to achieve with other techniques for gene expression analyses, such as Northern blot [1] or reverse transcription quantitative polymerase chain reaction (RT-qPCR) [2,3]. The Northern blot is a qualitative but low-throughput technique that requires the use of electrophoresis and large amounts of the input RNA [4]. RT-qPCR can achieve higher throughput levels with less amount of the input RNA than Northern blot, but the throughput remains on the order of hundreds of known transcripts at a time [4,5].
Although several types of microarray technologies exist, the DNA microarray is usually used for the transcriptome analysis. One microarray chip usually consists of thousands of spots, and each spot contains DNA oligonucleotides of a specific sequence [6]. These DNA oligonucleotides are suitable for hybridization with DNA or RNA isolated from cells. Isolated RNAs are chemically labeled before hybridization. These labels, such as fluorescence dyes, are used to detect signal intensities of spots and determine the relative mRNA abundance among samples. One of the major DNA microarray applications is to measure the relative difference of mRNA abundance between two samples. For example, Figure 4.1 shows the procedure of a two-color microarray system [6]. Another popular microarray design is one-color microarray system, and data quality is essentially equivalent between one- and two-color approaches [7].
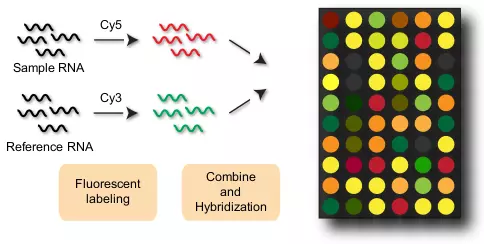
Figure 4.1. Microarray procedure.
Two samples are compared by a two-color DNA microarray. Sample RNA represents a sample of interest, whereas Reference RNA represents a control sample for comparison. Sample RNA is dyed red by Cy5, and Reference RNA is dyed green by Cy3. These two samples are combined and hybridized with DNA oligonucleotides on the chip. Color intensity is measured to estimate relative RNA expression levels of the two samples.
After measuring the intensity levels, the raw data usually go through normalization and transformation [8], and this whole process is usually called the pre-processing of microarray data. The pre-processing of the raw data is very important to reduce the noise in each sample at the local level and among multiple samples at the global level. In addition to detecting relative RNA expression levels, the DNA microarray can be used for other applications, such as the detection of single-nucleotide polymorphisms (SNPs), and alternative splicing events [9,4].
Two major drawbacks of microarray technologies are the limited ability to detect novel transcripts and noisy data even after pre-processing [4]. Nonetheless, the microarray technology is still widely used for many transcriptomics analyses because of the ability to measure the expression of thousands of genes simultaneously at relatively low cost.
4.2 The next generation sequencing methods are faster and more cost-effective than Sanger sequencing
As an alternative approach to the microarray technology, DNA sequencing approaches are also widely used for transcriptome analysis. The advantage of these sequencing methods is the ability to identify new transcripts and measure the abundance of transcripts directly [4]. First generation sequencing methods relied on the Sanger method [10]. Since the original Sanger method uses the full-length complementary DNA (FLcDNA), it involves a complex in vivo cloning step that usually results in very high cost. Therefore, the original Sanger method is normally limited only to novel transcript discovery and annotation [4].
Two examples of Sanger method applications are expressed sequence tag (EST) [11] and Serial Analysis of Gene Expression (SAGE) [12]. Both approaches use shorter tags, which are short sub-sequences of the cDNA sequence, rather than the FLcDNAs. ESTs are short tags generated from either 3’ or 5’ end of a cDNA clone. Even though the sequencing cost is reduced by ESTs compared with FLcDNAs, it is still too expensive for the whole transcriptome analysis [4]. SAGE is a method that uses short tags generated from 3’ ends of mRNA transcripts. SAGE is suitable for estimating transcript abundance due to high redundancy of sequencing reads [4]. However, SAGE is still costly for the transcriptome analysis because it still relies on labor intensive in vivo cloning procedures [4].
The next generation, or the second generation, sequencing methods have substantially improved upon the Sanger method. They produce millions of short reads in a relatively short period of time [13] depending on several criteria, such as read length, sequence coverage, and the size of the genome of interest (Table 4.1). The reads are assembled computationally afterwards if necessary. The major contribution to this enhancement is to parallelize the sequencing process [14], though other features, such as the usage of PCR-based amplification instead of costly and labor intensive in vivo cloning, also contribute [4]. Three popular commercially available next generation sequencing technologies are, Roche 454 (http://454.com), Illumina (https://www.illumina.com), and Applied Biosystems SOLiD (https://www.appliedbiosystems.com) (Table 4.1). The second generation sequencing can be used for all the applications that are based on the Sanger method, including EST and SAGE. Some applications that are based on the second generation sequencing are explained in the next section.
Table 4.1. Next generation sequencing technologies.
The table shows three examples of commercially available next generation sequencing technologies with specifications obtained from their corresponding web sites as of March 2011. “bp” and “Gb” represent base pairs and giga base pairs respectively. The product type with the best specification is selected for each technology. Both 2 × n and n × m represent the read length of the pair end approach where n and m are read lengths in base pairs.
| Roche 454 | Illumina | SOLiD | |
|---|---|---|---|
| Product type | GS FLX | HiSeq 2000 | 5500xl |
| Read length | 400 bp | 1 × 35 bp | 75 bp |
| 2 × 50 bp | 75 bp × 35 bp | ||
| 2 × 100 bp | 60 bp × 60 bp | ||
| Throughput per day | 1 Gb | 25 Gb | 20-30 Gb |
Third generation sequencing techniques will be available in the near future. The main feature of the third generation is the ability to sequence the whole single molecule instead of breaking down the molecule into short reads, therefore the read lengths should be much longer than those of the second generation sequencing technologies. Several strong candidates that may lead the third generation sequencing are Pacific Bioscience SMRT Sequencing (https://www.pacificbiosciences.com), Oxford Nanopore technologies (https://www.nanoporetech.com/), and Life technologies Single Molecule Sequencing (https://www.lifetechnologies.com).
4.3 The second generation sequencing technologies can cover a wide range of applications
The second generation sequencing can be used in many different applications because of its high-throughput and cost effectiveness. For example, the applications can be transcript rearrangement discovery, single-nucleotide variation profiling, and non-coding RNA discovery [4]. Two such applications, RNA-Seq and CLIP (Cross-Linking and ImmunoPrecipitation)-Seq, are very powerful and useful for transcriptomic analyses.
RNA-Seq or the whole transcriptome shotgun sequencing (WTSS) is a technique that uses the second generation sequencing technology to produce sequence reads at the whole transcriptome level [15,16]. Since the second generation sequencing technology can yield sufficient sequencing depth, which represents the total number of sequence reads generated from a sequencing library [4], RNA-Seq can be used for gene expression profiling with high accuracy.
CLIP-Seq [17], also called HITS-CLIP (High throughput sequencing CLIP) [18], is a technique that employs three important steps, cross-linking, immunoprecipitation, and next generation sequencing. It can be used to tag and pull-down RNA-interacting proteins of interest and infer the interactions between RNAs and RNA-binding proteins. Firstly, RNA binding proteins and their target RNA regions are cross-linked by ultraviolet (UV) light, and the antibodies for the proteins are used for immunoprecipitation [19]. Subsequently, the RNA transcripts pulled down with the proteins go through the second generation sequencing procedure [17]. RIP (Ribonucleoprotein ImmunoPrecipitation)-Seq is similar to CLIP-Seq [20], but it uses chemical cross-linkers such as formaldehyde instead of UV cross-linking [21,22]. This cross-linking is reversible, and it is subject to potential reassociation between RNAs and RNA-binding proteins after cell lysis in some cases [23].
4.4 Liquid chromatography-tandem mass spectrometry is a powerful tool to analyze quantitative proteomics
In recent years, several new technologies for the identification and quantification of proteins have emerged. Most of them are based on mass-spectrometry (MS), which is a technique that ionizes molecules and measures the mass-to-charge ratio by detecting them in an electromagnetic field [24]. Although there are many variants of MS-based technologies [25], the Liquid chromatography-tandem mass spectrometry (LC-MS/MS) with stable isotope labeling with amino acids in cell culture (SILAC) [26] approach is widely used in detecting protein expression profiles.
LC-MS/MS uses high-performance liquid chromatography that can separate a mixture of molecules with very small particles and a high pressure before the MS/MS phase. MS/MS, or tandem mass spectrometry, involves two steps of MS selections. The first MS can be used for the quantification of peptides, and the second MS can be used for the identification of the peptides [25].
LC-MS/MS is usually combined with either labeling or labeling-free methods for a quantification approach. For example, SILAC tends to be used for small changes (10%-50%), and isotope tags for relative and absolute quantification (iTRAQ), which is another labeling method, tends to be used for moderate changes (50%-200%) [25]. Moreover, a labeling-free method using spectrum counts can be used for large changes (>100%) [25]. Among them, SILAC is a simple but very powerful method for quantitative proteomics [27]. The SILAC procedure uses two different stable amino acid isotopes, as “light” and “heavy” labels. The relative abundance of proteins can be detected by comparing the intensities of isotope clusters [25,27].
The coverage of protein identification in the genome is usually less than 10% for higher organisms [28] due to enormous molecular complexity and the dynamic nature of proteins, such as post-translational modifications and protein stability [25]. However, the protein coverage of quantification is even lower than the protein identification. One possible explanation for this low coverage is that protein quantification requires much higher data quality, in terms of information content, than protein identification [28].
4.5 Most preprocessed and raw data sets from high-throughput experiments are publicly available
Two major repositories for microarray experiment data are ArrayExpress (https://www.ebi.ac.uk/arrayexpress) [29] at European Bioinformatics Institute (EBI), and Gene Expression Omnibus (GEO) (https://www.ncbi.nlm.nih.gov/geo) [30] at National Center for Biotechnology Information (NCBI). Both repositories encourage submitters to supply Minimum Information About a Microarray Experiment (MIAME) [31] compliant data. MIAME is a standard for the microarray data formats. caption The major repository for the next generation sequencing data is the Sequence Read Archive (SRA), which is operated by the International Nucleotide Sequence Database Collaboration (INSDC) [32]. However, due to a rapid growth of next generation sequencing data and budget constrains, NCBI, which is the main member of INSDS, currently accepts limited types and forms of the next generation sequencing data.
There are no central repositories for quantitative proteomics data, but many small and medium scale public repositories are available instead. Some of the examples of such repositories [33] are Proteomics IDEntifications database (PRIDE) [34], the Global Proteome Machine database (GPMDB) [35], and PeptideAtlas [36].
References
- Alwine JC, Kemp DJ, Stark GR. Method for detection of specific RNAs in agarose gels by transfer to diazobenzyloxymethyl-paper and hybridization with DNA probes. Proceedings of the National Academy of Sciences 1977;74:5350–4. https://doi.org/10.1073/pnas.74.12.5350.
- Becker-André M, Hahlbrock K. Absolute mRNA quantification using the polymerase chain reaction (PCR). A novel approach by aPCR aidedtranscipttitration assay (PATTY). Nucleic Acids Research 1989;17:9437–46. https://doi.org/10.1093/nar/17.22.9437.
- Noonan KE, Beck C, Holzmayer TA, Chin JE, Wunder JS, Andrulis IL, et al. Quantitative analysis of MDR1 (multidrug resistance) gene expression in human tumors by polymerase chain reaction. Proceedings of the National Academy of Sciences 1990;87:7160–4. https://doi.org/10.1073/pnas.87.18.7160.
- Morozova O, Hirst M, Marra MA. Applications of new sequencing technologies for transcriptome analysis. Annual Review of Genomics and Human Genetics 2009;10:135–51. https://doi.org/10.1146/annurev-genom-082908-145957.
- VanGuilder HD, Vrana KE, Freeman WM. Twenty-five years of quantitative PCR for gene expression analysis. BioTechniques 2008;44:619–26. https://doi.org/10.2144/000112776.
- Quackenbush J. Microarray analysis and tumor classification. New England Journal of Medicine 2006;354:2463–72. https://doi.org/10.1056/nejmra042342.
- Patterson TA, Lobenhofer EK, Fulmer-Smentek SB, Collins PJ, Chu T-M, Bao W, et al. Performance comparison of one-color and two-color platforms within the Microarray Quality Control (MAQC) project. Nature Biotechnology 2006;24:1140–50. https://doi.org/10.1038/nbt1242.
- Quackenbush J. Microarray data normalization and transformation. Nature Genetics 2002;32:496–501. https://doi.org/10.1038/ng1032.
- Mockler TC, Ecker JR. Applications of DNA tiling arrays for whole-genome analysis. Genomics 2005;85:1–15. https://doi.org/10.1016/j.ygeno.2004.10.005.
- Sanger F, Nicklen S, Coulson AR. DNA sequencing with chain-terminating inhibitors. Proceedings of the National Academy of Sciences 1977;74:5463–7. https://doi.org/10.1073/pnas.74.12.5463.
- Adams M, Kelley J, Gocayne J, Dubnick M, Polymeropoulos M, Xiao H, et al. Complementary DNA sequencing: expressed sequence tags and human genome project. Science 1991;252:1651–6. https://doi.org/10.1126/science.2047873.
- Velculescu VE, Zhang L, Vogelstein B, Kinzler KW. Serial analysis of gene expression. Science 1995;270:484–7. https://doi.org/10.1126/science.270.5235.484.
- Voelkerding KV, Dames S, Durtschi JD. Next generation sequencing for clinical diagnostics-principles and application to targeted resequencing for hypertrophic cardiomyopathy. The Journal of Molecular Diagnostics 2010;12:539–51. https://doi.org/10.2353/jmoldx.2010.100043.
- Hall N. Advanced sequencing technologies and their wider impact in microbiology. Journal of Experimental Biology 2007;210:1518–25. https://doi.org/10.1242/jeb.001370.
- Morin RD, Bainbridge M, Fejes A, Hirst M, Krzywinski M, Pugh TJ, et al. Profiling the HeLa S3 transcriptome using randomly primed cDNA and massively parallel short-read sequencing. BioTechniques 2008;45:81–94. https://doi.org/10.2144/000112900.
- Nagalakshmi U, Wang Z, Waern K, Shou C, Raha D, Gerstein M, et al. The transcriptional landscape of the yeast genome defined by RNA sequencing. Science 2008;320:1344–9. https://doi.org/10.1126/science.1158441.
- Sanford JR, Wang X, Mort M, VanDuyn N, Cooper DN, Mooney SD, et al. Splicing factor SFRS1 recognizes a functionally diverse landscape of RNA transcripts. Genome Research 2008;19:381–94. https://doi.org/10.1101/gr.082503.108.
- Licatalosi DD, Mele A, Fak JJ, Ule J, Kayikci M, Chi SW, et al. HITS-CLIP yields genome-wide insights into brain alternative RNA processing. Nature 2008;456:464–9. https://doi.org/10.1038/nature07488.
- Jensen KB, Darnell RB. CLIP: crosslinking and ImmunoPrecipitation of in vivo RNA targets of RNA-binding proteins. Methods in Molecular Biology, vol. 488, Humana Press; 2008, p. 85–98. https://doi.org/10.1007/978-1-60327-475-3_6.
- Wong E, Wei C-L. ChIP’ing the mammalian genome: technical advances and insights into functional elements. Genome Medicine 2009;1:89. https://doi.org/10.1186/gm89.
- Niranjanakumari S, Lasda E, Brazas R, Garcia-Blanco MA. Reversible cross-linking combined with immunoprecipitation to study RNA-protein interactions in vivo. Methods 2002;26:182–90. https://doi.org/10.1016/s1046-2023(02)00021-x.
- Conrad NK. Co-immunoprecipitation techniques for assessing RNA-protein interactions in vivo. Methods in Enzymology, vol. 449, Elsevier; 2008, p. 317–42. https://doi.org/10.1016/s0076-6879(08)02415-4.
- Mili S, Steitz JA. Evidence for reassociation of RNA-binding proteins after cell lysis: Implications for the interpretation of immunoprecipitation analyses. RNA 2004;10:1692–4. https://doi.org/10.1261/rna.7151404.
- Boggess B. Mass spectrometry desk reference (Sparkman, O. David). Journal of Chemical Education 2001;78:168. https://doi.org/10.1021/ed078p168.2.
- Mallick P, Kuster B. Proteomics: a pragmatic perspective. Nature Biotechnology 2010;28:695–709. https://doi.org/10.1038/nbt.1658.
- Ong S-E, Blagoev B, Kratchmarova I, Kristensen DB, Steen H, Pandey A, et al. Stable isotope labeling by amino acids in cell culture, SILAC, as a simple and accurate approach to expression proteomics. Molecular & Cellular Proteomics 2002;1:376–86. https://doi.org/10.1074/mcp.m200025-mcp200.
- Ong S-E, Mann M. Mass spectrometry-based proteomics turns quantitative. Nature Chemical Biology 2005;1:252–62. https://doi.org/10.1038/nchembio736.
- Bantscheff M, Schirle M, Sweetman G, Rick J, Kuster B. Quantitative mass spectrometry in proteomics: a critical review. Analytical and Bioanalytical Chemistry 2007;389:1017–31. https://doi.org/10.1007/s00216-007-1486-6.
- Parkinson H, Sarkans U, Kolesnikov N, Abeygunawardena N, Burdett T, Dylag M, et al. ArrayExpress update–an archive of microarray and high-throughput sequencing-based functional genomics experiments. Nucleic Acids Research 2010;39:D1002–D1004. https://doi.org/10.1093/nar/gkq1040.
- Barrett T, Edgar R. [19] Gene expression omnibus: microarray data storage, submission, retrieval, and analysis. Methods in Enzymology, vol. 411, Elsevier; 2006, p. 352–69. https://doi.org/10.1016/s0076-6879(06)11019-8.
- Brazma A, Hingamp P, Quackenbush J, Sherlock G, Spellman P, Stoeckert C, et al. Minimum information about a microarray experiment (MIAME)—toward standards for microarray data. Nature Genetics 2001;29:365–71. https://doi.org/10.1038/ng1201-365.
- Leinonen R, Sugawara H, Shumway M. The sequence read archive. Nucleic Acids Research 2010;39:D19–D21. https://doi.org/10.1093/nar/gkq1019.
- Mead JA, Bianco L, Bessant C. Recent developments in public proteomic MS repositories and pipelines. PROTEOMICS 2009;9:861–81. https://doi.org/10.1002/pmic.200800553.
- Jones P, Côté RG, Martens L, Quinn AF, Taylor CF, Derache W, et al. PRIDE: a public repository of protein and peptide identifications for the proteomics community. Nucleic Acids Research 2006;34:D659–D663. https://doi.org/10.1093/nar/gkj138.
- Craig R, Cortens JP, Beavis RC. Open source system for analyzing, validating, and storing protein identification data. Journal of Proteome Research 2004;3:1234–42. https://doi.org/10.1021/pr049882h.
- Deutsch EW. The PeptideAtlas project. Methods in Molecular Biology, vol. 604, Humana Press; 2009, p. 285–96. https://doi.org/10.1007/978-1-60761-444-9_19.