Supplementary information: Target gene expression levels and competition between transfected and endogenous microRNAs are strong confounding factors in microRNA high-throughput experiments
Takay Saito1 and Pål Sætrom1,2
Saito, T and Sætrom, P. Target gene expression levels and competition between transfected and endogenous microRNAs are strong confounding factors in microRNA high-throughput experiments. Silence 3, 3 (2012). https://doi.org/10.1186/1758-907X-3-3.
Table of contents
- Supplementary Tables
- Table S1. Summary of miRNA high-throughput experiments.
- Table S2. Samples and miRNAs of miRNA high-throughput experiments.
- Table S3. P-values of multiple Wilcoxon rank-sum tests on 5 subgroups of 3’ UTR length.
- Table S4. P-values of multiple Wilcoxon rank-sum tests on 4 subgroups of 3’ UTR conservation.
- Table S5. P-values of multiple Wilcoxon rank-sum tests on 6 subgroups of mRNA expression.
- Table S6. P-values of multiple Kolmogorov–Smirnov tests on 5 subgroups of 3’ UTR length.
- Table S7. P-values of multiple Kolmogorov–Smirnov tests on 4 subgroups of 3’ UTR conservation.
- Table S8. P-values of multiple Kolmogorov–Smirnov tests on 6 subgroups of mRNA expression.
- Table S9. Sample level scores of Wilcoxon rank-sum tests on 3’ UTR length.
- Table S10. Sample level scores of Wilcoxon rank-sum tests on 3’ UTR conservation.
- Table S11. Sample level scores of Wilcoxon rank-sum tests on mRNA expression.
- Table S12. The number of genes for four gene groups, T -Endo, T +Endo, NT -Endo, and NT -Endo, per experiment.
- Table S13. P-values of multiple Wilcoxon rank-sum tests between T -Endo and T +Endo on 5 subgroups of 3’ UTR length.
- Table S14. P-values of multiple Wilcoxon rank-sum tests between T -Endo and T +Endo on 5 subgroups of 3’ UTR conservation.
- Table S15. P-values of multiple Wilcoxon rank-sum tests between T -Endo and T +Endo on 5 subgroups of mRNA expression.
- Table S16. Comparisons of Wilcoxon rank-sum tests for T -Endo against T +Endo between experimental and individual sample levels.
- Table S17. Coefficients and p-values of linear regression with eight factors.
- Table S18. Coefficients and p-values of linear regression with eight factors and factor crossing.
- Table S19. Coefficients and p-values of linear regression with nine factors.
- Table S20. Coefficients and p-values of linear regression with nine factors and factor crossing.
- Table S21. P-values of multiple Wilcoxon rank-sum tests on 3 subgroups of CpG frequency.
- Table S22. P-values of multiple Wilcoxon rank-sum tests on 2 subgroups of developmental genes.
- Table S23. P-values of multiple Wilcoxon rank-sum tests on 2 subgroups of housekeeping genes.
- Supplementary Figures
- Figure S1. mRNA expression levels from 6 microarray and 2 proteomics experiments.
- Figure S2. Log2 enrichment of down-regulated genes compared with all genes mRNA.
- Figure S3. Scatter plot of the total tag counts versus total number of miRNA target sites.
- Figure S4. Coefficients of a linear regression with eight factors and factor crossing.
- Figure S5. Coefficients of a linear regression with nine factors and factor crossing.
Supplementary Tables
Table S1. Summary of miRNA high-throughput experiments.
| Experiment | # of unique miRNAs | # of samples | Type * |
|---|---|---|---|
| Baek MA | 3 | 3 | M |
| Baek | 3 | 3 | P |
| Lim | 7 | 14 | M |
| Jackson | 26 | 66 | M |
| Linsley | 9 | 23 | M |
| Linsley OME | 2 | 2 | M_OME |
| Grimson | 9 | 18 | M |
| Selbach LNA | 1 | 1 | P_LNA |
| Selbach MA | 5 | 5 | M |
| Selbach | 5 | 5 | P |
- Type: types of experiments as Micrroarray overexpression (M), Proteomics overexpression (P), Microarray inhibition (M_OME), and Proteomics inhibition (P_LNA).letter-spacing
Table S2. Samples and miRNAs of miRNA high-throughput experiments.
| Experiment | Sample ID * | Internal miRNA ID |
|---|---|---|
| Baek MA | baek_m_mir_1 | baek_m_mir_1 |
| Baek MA | baek_m_mir_124 | baek_m_mir_124 |
| Baek MA | baek_m_mir_181 | baek_m_mir_181 |
| Baek | baek_p_mir_1 | baek_p_mir_1 |
| Baek | baek_p_mir_124 | baek_p_mir_124 |
| Baek | baek_p_mir_181 | baek_p_mir_181 |
| Lim | GSM37602 | mirna-lim2005-chimiR-1/124 |
| Lim | GSM37603 | mirna-lim2005-chimiR-1/124 |
| Lim | GSM37604 | mirna-lim2005-chimiR-124/1 |
| Lim | GSM37605 | mirna-lim2005-chimiR-124/1 |
| Lim | GSM37598 | mirna-lim2005-miR-1 |
| Lim | GSM37599 | mirna-lim2005-miR-1 |
| Lim | GSM37600 | mirna-lim2005-miR-124 |
| Lim | GSM37601 | mirna-lim2005-miR-124 |
| Lim | GSM37606 | mirna-lim2005-miR-124mut5-6 |
| Lim | GSM37607 | mirna-lim2005-miR-124mut5-6 |
| Lim | GSM37608 | mirna-lim2005-miR-124mut9-10 |
| Lim | GSM37609 | mirna-lim2005-miR-124mut9-10 |
| Lim | GSM37610 | mirna-lim2005-miR-373 |
| Lim | GSM37611 | mirna-lim2005-miR-373 |
| Jackson | GSM133702 | sirna-jackson2006wso-1 |
| Jackson | GSM134468 | sirna-jackson2006wso-1 |
| Jackson | GSM133701 | sirna-jackson2006wso-10 |
| Jackson | GSM134485 | sirna-jackson2006wso-10 |
| Jackson | GSM134508 | sirna-jackson2006wso-10 |
| Jackson | GSM133700 | sirna-jackson2006wso-11 |
| Jackson | GSM134484 | sirna-jackson2006wso-11 |
| Jackson | GSM134507 | sirna-jackson2006wso-11 |
| Jackson | GSM134483 | sirna-jackson2006wso-12 |
| Jackson | GSM134506 | sirna-jackson2006wso-12 |
| Jackson | GSM133699 | sirna-jackson2006wso-13 |
| Jackson | GSM134482 | sirna-jackson2006wso-13 |
| Jackson | GSM134505 | sirna-jackson2006wso-13 |
| Jackson | GSM133698 | sirna-jackson2006wso-14 |
| Jackson | GSM134481 | sirna-jackson2006wso-14 |
| Jackson | GSM134504 | sirna-jackson2006wso-14 |
| Jackson | GSM133697 | sirna-jackson2006wso-15 |
| Jackson | GSM134480 | sirna-jackson2006wso-15 |
| Jackson | GSM134503 | sirna-jackson2006wso-15 |
| Jackson | GSM133696 | sirna-jackson2006wso-16 |
| Jackson | GSM134479 | sirna-jackson2006wso-16 |
| Jackson | GSM134502 | sirna-jackson2006wso-16 |
| Jackson | GSM133695 | sirna-jackson2006wso-17 |
| Jackson | GSM134478 | sirna-jackson2006wso-17 |
| Jackson | GSM134501 | sirna-jackson2006wso-17 |
| Jackson | GSM133686 | sirna-jackson2006wso-18 |
| Jackson | GSM134477 | sirna-jackson2006wso-18 |
| Jackson | GSM134500 | sirna-jackson2006wso-18 |
| Jackson | GSM133694 | sirna-jackson2006wso-19 |
| Jackson | GSM134476 | sirna-jackson2006wso-19 |
| Jackson | GSM134499 | sirna-jackson2006wso-19 |
| Jackson | GSM133685 | sirna-jackson2006wso-20 |
| Jackson | GSM134475 | sirna-jackson2006wso-20 |
| Jackson | GSM134498 | sirna-jackson2006wso-20 |
| Jackson | GSM133693 | sirna-jackson2006wso-21 |
| Jackson | GSM134474 | sirna-jackson2006wso-21 |
| Jackson | GSM134497 | sirna-jackson2006wso-21 |
| Jackson | GSM133692 | sirna-jackson2006wso-22 |
| Jackson | GSM134473 | sirna-jackson2006wso-22 |
| Jackson | GSM134496 | sirna-jackson2006wso-22 |
| Jackson | GSM133691 | sirna-jackson2006wso-23 |
| Jackson | GSM134472 | sirna-jackson2006wso-23 |
| Jackson | GSM134495 | sirna-jackson2006wso-23 |
| Jackson | GSM133690 | sirna-jackson2006wso-24 |
| Jackson | GSM134471 | sirna-jackson2006wso-24 |
| Jackson | GSM134494 | sirna-jackson2006wso-24 |
| Jackson | GSM133687 | sirna-jackson2006wso-25 |
| Jackson | GSM134470 | sirna-jackson2006wso-25 |
| Jackson | GSM134493 | sirna-jackson2006wso-25 |
| Jackson | GSM133684 | sirna-jackson2006wso-26 |
| Jackson | GSM134469 | sirna-jackson2006wso-26 |
| Jackson | GSM134492 | sirna-jackson2006wso-26 |
| Jackson | GSM134467 | sirna-jackson2006wso-27 |
| Jackson | GSM134466 | sirna-jackson2006wso-28 |
| Jackson | GSM134488 | sirna-jackson2006wso-30 |
| Jackson | GSM134491 | sirna-jackson2006wso-31 |
| Jackson | GSM134511 | sirna-jackson2006wso-4 |
| Jackson | GSM134512 | sirna-jackson2006wso-5 |
| Jackson | GSM133688 | sirna-jackson2006wso-7 |
| Jackson | GSM134487 | sirna-jackson2006wso-7 |
| Jackson | GSM134489 | sirna-jackson2006wso-7 |
| Jackson | GSM134510 | sirna-jackson2006wso-7 |
| Jackson | GSM133689 | sirna-jackson2006wso-8 |
| Jackson | GSM134486 | sirna-jackson2006wso-8 |
| Jackson | GSM134490 | sirna-jackson2006wso-8 |
| Jackson | GSM134509 | sirna-jackson2006wso-8 |
| Linsley | GSM156557 | mirna-linsley2007-let-7c |
| Linsley | GSM156558 | mirna-linsley2007-let-7c |
| Linsley | GSM156544 | mirna-linsley2007-miR-103 |
| Linsley | GSM156580 | mirna-linsley2007-miR-103 |
| Linsley | GSM156523 | mirna-linsley2007-miR-15a |
| Linsley | GSM156545 | mirna-linsley2007-miR-15a |
| Linsley | GSM156549 | mirna-linsley2007-miR-15a |
| Linsley | GSM156577 | mirna-linsley2007-miR-15a |
| Linsley | GSM156522 | mirna-linsley2007-miR-16 |
| Linsley | GSM156546 | mirna-linsley2007-miR-16 |
| Linsley | GSM156550 | mirna-linsley2007-miR-16 |
| Linsley | GSM156579 | mirna-linsley2007-miR-16 |
| Linsley | GSM156553 | mirna-linsley2007-miR-17-5p |
| Linsley | GSM156555 | mirna-linsley2007-miR-17-5p |
| Linsley | GSM156547 | mirna-linsley2007-miR-192 |
| Linsley | GSM156551 | mirna-linsley2007-miR-192 |
| Linsley | GSM156554 | mirna-linsley2007-miR-20 |
| Linsley | GSM156556 | mirna-linsley2007-miR-20 |
| Linsley | GSM156548 | mirna-linsley2007-miR-215 |
| Linsley | GSM156552 | mirna-linsley2007-miR-215 |
| Linsley | GSM156524 | mirna-linsley2007_miR_106b |
| Linsley | GSM156543 | mirna-linsley2007_miR_106b |
| Linsley | GSM156576 | mirna-linsley2007_miR_106b |
| Linsley OME | GSM155603 | mirna-linsley2007OME-miR-16 |
| Linsley OME | GSM155605 | mirna-linsley2007OME_miR_106b |
| Grimson | GSM210900 | mirna-grimson2007-miR-122a |
| Grimson | GSM210901 | mirna-grimson2007-miR-122a |
| Grimson | GSM210902 | mirna-grimson2007-miR-128a |
| Grimson | GSM210903 | mirna-grimson2007-miR-128a |
| Grimson | GSM210904 | mirna-grimson2007-miR-132 |
| Grimson | GSM210905 | mirna-grimson2007-miR-132 |
| Grimson | GSM210906 | mirna-grimson2007-miR-133a |
| Grimson | GSM210907 | mirna-grimson2007-miR-133a |
| Grimson | GSM210908 | mirna-grimson2007-miR-142-3p |
| Grimson | GSM210909 | mirna-grimson2007-miR-142-3p |
| Grimson | GSM210910 | mirna-grimson2007-miR-148a |
| Grimson | GSM210911 | mirna-grimson2007-miR-148a |
| Grimson | GSM210912 | mirna-grimson2007-miR-181a |
| Grimson | GSM210913 | mirna-grimson2007-miR-181a |
| Grimson | GSM210896 | mirna-grimson2007-miR-7 |
| Grimson | GSM210897 | mirna-grimson2007-miR-7 |
| Grimson | GSM210898 | mirna-grimson2007-miR-9 |
| Grimson | GSM210899 | mirna-grimson2007-miR-9 |
| Selbach LNA | psilac_p_let_7 | psilac_p_let_7 |
| Selbach MA | psilac_m_let_7_oe | psilac_m_let_7_oe |
| Selbach MA | psilac_m_mir1 | psilac_m_mir1 |
| Selbach MA | psilac_m_mir155 | psilac_m_mir155 |
| Selbach MA | psilac_m_mir16 | psilac_m_mir16 |
| Selbach MA | psilac_m_mir30 | psilac_m_mir30 |
| Selbach | psilac_p_let_7_oe | psilac_p_let_7_oe |
| Selbach | psilac_p_mir1 | psilac_p_mir1 |
| Selbach | psilac_p_mir155 | psilac_p_mir155 |
| Selbach | psilac_p_mir16 | psilac_p_mir16 |
| Selbach | psilac_p_mir30 | psilac_p_mir30 |
- Sample ID: GEO Sample IDs for microarray experiments. Sample IDs are equivalent with Internal miRNA IDs for Baek MA, Baek, Selbach LNA, Selbach MA, and Selbach.
Table S3. P-values of multiple Wilcoxon rank-sum tests on 5 subgroups of 3’ UTR length.
| Experiment | Very Long | Long | Med Long | Med Short | Short |
|---|---|---|---|---|---|
| Grimson | 1 | 0.0001097** | 1.49E-06** | 0.9987 | 0.877 |
| Linsley | 1 | 1 | 1.34E-14** | 0.0001561** | 1.47E-08** |
| Lim | 1 | 1 | 2.53E-08** | 4.02E-17** | 0.001384* |
| Jackson | 1 | 0.9861 | 5.66E-07** | 2.98E-09** | 0.02786* |
| Baek | 0.6108 | 0.4996 | 0.6649 | 0.1129 | 0.7686 |
| Selbach | 0.9963 | 0.9267 | 0.1218 | 0.005917* | 0.0206* |
| Baek MA | 1 | 0.9988 | 0.0001289** | 1.43E-11** | 0.01611* |
| Selbach MA | 1 | 0.3123 | 0.002443* | 0.004716* | 0.3854 |
| Selbach LNA | 0.4236 | 0.2408 | 0.9639 | 0.1824 | 0.4064 |
| Linsley OME | 0.998 | 0.7781 | 0.004476* | 0.2858 | 0.4708 |
Lower p-values indicate that a set of genes in one sub-group is more down-regulated than a set of genes in the rest of subgroups. “*” and “**” are added when the p-value is less than 0.05 and Sidak adjusted (n=50) 0.001, respectively.
Table S4. P-values of multiple Wilcoxon rank-sum tests on 4 subgroups of 3’ UTR conservation.
| Experiment | High | Medium | Low | NoConsv |
|---|---|---|---|---|
| Grimson | 3.18E-91** | 1.73E-05** | 1 | 1 |
| Linsley | 1.54E-140** | 9.71E-09** | 1 | 1 |
| Lim | 0.9605 | 1 | 0.7262 | 1.68E-12** |
| Jackson | 2.00E-14** | 0.442 | 0.9999 | 0.9971 |
| Baek | 0.4501 | 0.06762 | 0.9964 | 0.1565 |
| Selbach | 0.04254* | 0.7226 | 0.5001 | 0.8695 |
| Baek MA | 0.5789 | 0.9598 | 0.8468 | 0.003194* |
| Selbach MA | 6.11E-11** | 0.003409* | 1 | 0.9809 |
| Selbach LNA | 0.07027 | 0.9596 | 0.02426* | 0.9181 |
| Linsley OME | 0.9973 | 0.09355 | 0.2657 | 0.2918 |
Lower p-values indicate that a set of genes in one sub-group is more down-regulated than a set of genes in the rest of subgroups. “*” and “**” are added when the p-value is less than 0.05 and Sidak adjusted (n=40) 0.0013, respectively.
Table S5. P-values of multiple Wilcoxon rank-sum tests on 6 subgroups of mRNA expression.
| Experiment | Very High | High | Medium | Low | Very Low | NoExp |
|---|---|---|---|---|---|---|
| Grimson | 2.42E-90** | 8.74E-62** | 8.63E-20** | 0.007846* | 1 | 1 |
| Linsley† | 4.98E-143** | 3.67E-91** | 5.32E-44** | 0.9826 | 1 | 1 |
| Lim | 1.51E-26** | 0.003186* | 0.2223 | 0.9964 | 1 | 1 |
| Jackson | 1.83E-50** | 6.25E-12** | 0.06033 | 0.001487* | 1 | 1 |
| Baek | 0.1497 | 0.1157 | 0.9956 | 0.1983 | 0.9733 | 0.534 |
| Selbach | 0.4526 | 0.8428 | 0.1576 | 0.03415* | 0.9953 | 0.9641 |
| Baek MA | 4.62E-23** | 0.00139* | 7.83E-06** | 0.3092 | 0.9998 | 1 |
| Selbach MA | 2.94E-27** | 1.49E-07** | 0.0004135** | 0.9689 | 1 | 1 |
| Selbach LNA | 0.9988 | 0.3202 | 0.1359 | 0.01038* | 0.2094 | 0.615 |
| Linsley OME | 0.06633 | 1.30E-11** | 6.57E-06** | 2.07E-09** | 1 | 1 |
Lower p-values indicate that a set of genes in one sub-group is more down-regulated than a set of genes in the rest of subgroups. “*” and “**” are added when the p-value is less than 0.05 and Sidak adjusted (n=60) 0.00086, respectively.
† The expression levels were measured for the HeLa cells, but some other cell line was used in the Linsley experiment. It is included only for comparison purpose.
Table S6. P-values of multiple Kolmogorov–Smirnov tests on 5 subgroups of 3’ UTR length.
| Experiment | Very Long | Long | Med Long | Med Short | Short |
|---|---|---|---|---|---|
| Grimson | 0.9916 | 1.44E-06** | 0.0001501** | 0.3243 | 0.04871* |
| Linsley | 0.9712 | 0.9938 | 1.19E-15** | 0.0001545** | 6.07E-06** |
| Lim | 0.971 | 0.9478 | 4.99E-06** | 1.25E-14** | 0.0001177** |
| Jackson | 0.9979 | 0.848 | 1.12E-05** | 1.99E-06** | 0.001449* |
| Baek | 0.4815 | 0.683 | 0.8718 | 0.2318 | 0.488 |
| Selbach | 0.9702 | 0.6291 | 0.2414 | 0.01213* | 0.06909 |
| Baek MA | 0.9893 | 0.9797 | 0.0002018** | 4.00E-08** | 0.02661* |
| Selbach MA | 0.9962 | 0.35 | 0.0002901** | 0.0005103** | 0.1217 |
| Selbach LNA | 0.7271 | 0.2991 | 0.9337 | 0.1318 | 0.4176 |
| Linsley OME | 0.9239 | 0.4324 | 0.01998* | 0.1771 | 0.3337 |
Lower p-values indicate that a set of genes in one sub-group is more down-regulated than a set of genes in the rest of subgroups. “*” and “**” are added when the p-value is less than 0.05 and Sidak adjusted (n=50) 0.001, respectively.
Table S7. P-values of multiple Kolmogorov–Smirnov tests on 4 subgroups of 3’ UTR conservation.
| Experiment | High | Medium | Low | NoConsv |
|---|---|---|---|---|
| Grimson | 5.73E-92** | 8.36E-07** | 0.9862 | 0.9883 |
| Linsley | 4.24E-128** | 2.31E-13** | 0.9771 | 0.9449 |
| Lim | 0.01429* | 0.9909 | 0.5264 | 9.28E-18** |
| Jackson | 8.90E-21** | 0.01791* | 0.5197 | 0.1588 |
| Baek | 0.3584 | 0.04377* | 0.9078 | 0.3234 |
| Selbach | 0.07206 | 0.9122 | 0.6764 | 0.9017 |
| Baek MA | 0.503 | 0.9653 | 0.8533 | 0.002383* |
| Selbach MA | 1.01E-09** | 0.001672* | 1 | 0.479 |
| Selbach LNA | 0.02364* | 0.9725 | 0.08733 | 0.8624 |
| Linsley OME | 0.9865 | 0.05635 | 0.358 | 0.05104 |
Lower p-values indicate that a set of genes in one sub-group is more down-regulated than a set of genes in the rest of subgroups. “*” and “**” are added when the p-value is less than 0.05 and Sidak adjusted (n=40) 0.0013, respectively.
Table S8. P-values of multiple Kolmogorov–Smirnov tests on 6 subgroups of mRNA expression.
| Experiment | Very High | High | Medium | Low | Very Low | NoExp |
|---|---|---|---|---|---|---|
| Grimson | 4.40E-88** | 1.64E-57** | 1.73E-20** | 3.10E-05** | 0.9806 | 0.8833 |
| Linsley† | 2.83E-155** | 1.57E-115** | 1.00E-50** | 0.345 | 0.997 | 0.1561 |
| Lim | 2.53E-19** | 0.002125* | 0.001156* | 0.9981 | 0.8145 | 0.9976 |
| Jackson | 3.03E-50** | 1.33E-17** | 2.40E-05** | 0.0002529** | 0.9815 | 0.1539 |
| Baek | 0.14 | 0.1617 | 0.985 | 0.2345 | 0.7886 | 0.5328 |
| Selbach | 0.06506 | 0.8938 | 0.2683 | 0.0112* | 1 | 0.7825 |
| Baek MA | 5.61E-19** | 0.001805* | 2.06E-05** | 0.06406 | 0.9993 | 1 |
| Selbach MA | 2.26E-29** | 6.36E-12** | 1.94E-09** | 0.09846 | 0.8288 | 0.001052* |
| Selbach LNA | 0.9962 | 0.5803 | 0.08177 | 0.02633* | 0.387 | 0.6022 |
| Linsley OME | 0.007603* | 7.60E-13** | 1.11E-08** | 2.67E-09** | 0.6525 | 0.1083 |
Lower p-values indicate that a set of genes in one sub-group is more down-regulated than a set of genes in the rest of subgroups. “*” and “**” are added when the p-value is less than 0.05 and Sidak adjusted (n=60) 0.00086, respectively.
† The expression levels were measured for the HeLa cells, but some other cell line was used in the Linsley experiment. It is included only for comparison purpose.
Table S9. Sample level scores of Wilcoxon rank-sum tests on 3’ UTR length.
| Experiment | Very Long | Long | Med Long | Med Short | Short |
|---|---|---|---|---|---|
| Grimson | 0.06* | 0.39* | 0.39* | 0.17* | 0.06* |
| Linsley | 0 | 0.17* | 0.57* | 0.39* | 0.35* |
| Lim | 0 | 0 | 0.63** | 0.63** | 0.38* |
| Jackson | 0 | 0 | 0.21* | 0.39* | 0.12* |
| Baek | 0 | 0 | 0 | 0 | 0 |
| Selbach | 0 | 0 | 0 | 0.2* | 0.2* |
| Baek MA | 0 | 0 | 0.33* | 1** | 0.33* |
| Selbach MA | 0 | 0.2* | 0.6** | 0.6** | 0.2* |
| Selbach LNA | 0 | 0 | 0 | 0 | 0 |
| Linsley OME | 0 | 0 | 0.5* | 0 | 0 |
We performed the same Wilcoxon rank-sum tests as in Table S3 on samples instead of experiments. We then counted the number of samples that had a significant p-value (<0.05) to calculate the proportion per experiment as Sample level score. “*” and “**” are added when the score is between 0 and 0.5, and >0.5, respectively.
Table S10. Sample level scores of Wilcoxon rank-sum tests on 3’ UTR conservation.
| Experiment | High | Medium | Low | NoConsv |
|---|---|---|---|---|
| Grimson | 0.94** | 0.22* | 0 | 0 |
| Linsley | 0.83** | 0.3* | 0 | 0.09* |
| Lim | 0.25* | 0 | 0 | 0.5* |
| Jackson | 0.42* | 0 | 0.06* | 0.03* |
| Baek | 0 | 0.33* | 0 | 0 |
| Selbach | 0 | 0 | 0 | 0 |
| Baek MA | 0 | 0 | 0 | 0.33* |
| Selbach MA | 0.8** | 0.6** | 0 | 0.2* |
| Selbach LNA | 0 | 0 | 1** | 0 |
| Linsley OME | 0 | 0 | 0.5* | 0 |
We performed the same Wilcoxon rank-sum tests as in Table S4 on samples instead of experiments. We then counted the number of samples that had a significant p-value (<0.05) to calculate the proportion per experiment as Sample level score. “*” and “**” are added when the score is between 0 and 0.5, and >0.5, respectively.
Table S11. Sample level scores of Wilcoxon rank-sum tests on mRNA expression.
| Experiment | Very High | High | Medium | Low | Very Low | NoExp |
|---|---|---|---|---|---|---|
| Grimson | 0.83** | 0.89** | 0.5* | 0.33* | 0 | 0 |
| Linsley† | 1** | 1** | 0.91** | 0.09* | 0 | 0 |
| Lim | 0.88** | 0.13* | 0.25* | 0 | 0 | 0 |
| Jackson | 0.67** | 0.48* | 0.06* | 0.18* | 0 | 0 |
| Baek | 0 | 0 | 0 | 0 | 0 | 0 |
| Selbach | 0.2* | 0 | 0.2* | 0.2* | 0 | 0 |
| Baek MA | 1** | 0.67** | 0.67** | 0.33* | 0 | 0 |
| Selbach MA | 0.6** | 0.8** | 0.6** | 0.2* | 0 | 0 |
| Selbach LNA | 0 | 0 | 0 | 1** | 0 | 0 |
| Linsley OME | 0.5* | 1** | 1** | 1** | 0 | 0 |
We performed the same Wilcoxon rank-sum tests as in Table S5 on samples instead of experiments. We then counted the number of samples that had a significant p-value (<0.05) to calculate the proportion per experiment as Sample level score. “*” and “**” are added when the score is between 0 and 0.5, and >0.5, respectively.
† The expression levels were measured for the HeLa cells, but some other cell line was used in the Linsley experiment. It is included only for comparison purpose.
Table S12. The number of genes for four gene groups, T -Endo, T +Endo, NT -Endo, and NT -Endo, per experiment.
| Experiment | T -Endo | T +Endo | NT -Endo | NT +Endo |
|---|---|---|---|---|
| Grimson | 5103 | 35367 | 169623 | 244605 |
| Linsley | 1035 | 57458 | 222226 | 300284 |
| Lim | 1080 | 8026 | 76576 | 116406 |
| Jackson | 1987 | 12846 | 318344 | 500436 |
| Baek | 129 | 728 | 28992 | 45934 |
| Selbach | 95 | 1911 | 48440 | 75859 |
| Baek MA | 834 | 6444 | 28287 | 40218 |
| Selbach MA | 766 | 15518 | 47769 | 62252 |
| Selbach LNA | 0 | 280 | 9707 | 15274 |
| Linsley OME | 0 | 6388 | 19414 | 24720 |
Table S13. P-values of multiple Wilcoxon rank-sum tests between T -Endo and T +Endo on 5 subgroups of 3’ UTR length.
| Experiment | Very Long | Long | Med Long | Med Short | Short |
|---|---|---|---|---|---|
| Grimson | - | 0.004507* | 0.9984 | 0.9912 | 0.5245 |
| Linsley† | - | 0.0178* | 0.9859 | 0.4187 | 0.6971 |
| Lim | - | 3.10E-05** | 0.2057 | 0.1298 | 0.1892 |
| Jackson | - | 0.7745 | 0.2359 | 0.9576 | 0.3405 |
| Baek | - | 0.1639 | 0.5665 | 0.7491 | 0.758 |
| Selbach | - | 0.1493 | 0.005243* | 0.1131 | 0.3542 |
| Baek MA | - | 0.9775 | 0.915 | 0.2142 | 0.8701 |
| Selbach MA | - | 0.6107 | 0.8524 | 0.7769 | 0.481 |
| Selbach LNA†† | - | - | - | - | - |
| Linsley OME†† | - | - | - | - | - |
Lower p-values indicate that a set of T -Endo genes is more down-regulated than T +Endo genes. “*” and “**” are added when the p-value is less than 0.05 and Sidak adjusted (n=50) 0.001, respectively.
† Endogenous miRNAs of the HeLa cells were used to determine if a gene was influenced by any endogenous miRNAs or not (see the Methods). Although some other cell line was used in the Linsley experiment, it is included only for comparison purpose.
†† Two inhibition experiments, Selbach LNA and Linsley OME, were excluded as they inhibited endogenous miRNAs in the HeLa cells.
Table S14. P-values of multiple Wilcoxon rank-sum tests between T -Endo and T +Endo on 5 subgroups of 3’ UTR conservation.
| Experiment | High | Medium | Low | NoConsv |
|---|---|---|---|---|
| Grimson | 0.7221 | 0.3305 | 0.6551 | 0.8161 |
| Linsley† | 0.2087 | 0.4459 | 0.3561 | 0.06864 |
| Lim | 6.97E-07** | 1.29E-07** | 0.003608* | 0.002016* |
| Jackson | 0.01399* | 0.004478* | 0.0434* | 0.02414* |
| Baek | 0.6602 | 0.3803 | 0.6538 | 0.2719 |
| Selbach | 0.03193* | 0.01232* | 0.03732* | 0.02471* |
| Baek MA | 0.2123 | 0.1387 | 0.02438* | 0.1335 |
| Selbach MA | 0.2798 | 0.4313 | 0.6804 | 0.5433 |
| Selbach LNA†† | - | - | - | - |
| Linsley OME†† | - | - | - | - |
Lower p-values indicate that a set of T -Endo genes is more down-regulated than T +Endo genes. “*” and “**” are added when the p-value is less than 0.05 and Sidak adjusted (n=40) 0.0013, respectively.
† Endogenous miRNAs of the HeLa cells were used to determine if a gene was influenced by any endogenous miRNAs or not (see the Methods). Although some other cell line was used in the Linsley experiment, it is included only for comparison purpose.
†† Two inhibition experiments, Selbach LNA and Linsley OME, were excluded as they inhibited endogenous miRNAs in the HeLa cells.
Table S15. P-values of multiple Wilcoxon rank-sum tests between T -Endo and T +Endo on 5 subgroups of mRNA expression.
| Experiment | Very High | High | Medium | Low | Very Low | NoExp |
|---|---|---|---|---|---|---|
| Grimson | 0.2563 | 0.1928 | 0.8973 | 0.6207 | 0.7154 | 0.592 |
| Linsley† | 0.3367 | 0.6569 | 3.69E-06** | 0.7857 | 0.7779 | 0.6635 |
| Lim | 4.81E-07** | 1.98E-08** | 0.0009558* | 0.0001625** | 0.1774 | 0.5799 |
| Jackson | 0.02235* | 0.007227* | 0.0005593** | 0.05376 | 0.9965 | 0.1031 |
| Baek | 0.5206 | 0.1892 | 0.6363 | 0.7 | 0.5663 | 0.9338 |
| Selbach | 0.0009269* | 0.003826* | 0.4585 | 0.3507 | 0.2129 | 0.5656 |
| Baek MA | 0.03596* | 0.0002753** | 0.4101 | 0.526 | 0.1314 | 0.2536 |
| Selbach MA | 0.1056 | 0.4117 | 0.04419* | 0.649 | 0.9644 | 0.8361 |
| Selbach LNA†† | - | - | - | - | - | - |
| Linsley OME†† | - | - | - | - | - | - |
Lower p-values indicate that a set of T -Endo genes is more down-regulated than T +Endo genes. “*” and “**” are added when the p-value is less than 0.05 and Sidak adjusted (n=60) 0.00086, respectively.
† Endogenous miRNAs of the HeLa cells were used to determine if a gene was influenced by any endogenous miRNAs or not (see the Methods). Although some other cell line was used in the Linsley experiment, it is included only for comparison purpose.
†† Two inhibition experiments, Selbach LNA and Linsley OME, were excluded as they inhibited endogenous miRNAs in the HeLa cells.
Table S16. Comparisons of Wilcoxon rank-sum tests for T -Endo against T +Endo between experimental and individual sample levels.
| Factor | Subgroup | Expr | Smpl (>0.0) | Smpl (>0.5) |
|---|---|---|---|---|
| 3' UTR Length | Very Long | 0 | 0 | 0 |
| Long | 3 | 3 | 0 | |
| Med Long | 1 | 2 | 0 | |
| Med Short | 0 | 2 | 0 | |
| Short | 0 | 3 | 0 | |
| 3' UTR Cosv | High | 3 | 2 | 0 |
| Medium | 3 | 6 | 1 | |
| Low | 4 | 4 | 1 | |
| NoConsv | 3 | 5 | 0 | |
| mRNA Exp | Very High | 4 | 6 | 0 |
| High | 4 | 5 | 1 | |
| Medium | 4 | 4 | 0 | |
| Low | 1 | 3 | 0 | |
| Very Low | 0 | 1 | 0 | |
| NoExp | 0 | 3 | 0 |
Expr: the number of experiments that have significant p-value. Smpl: the number of experiments that have Sample level scores greater than either 0.0 (>0.0) or 0.5 (>0.5).
Table S17. Coefficients and p-values of linear regression with eight factors.
| Feature | Coef | P-value | -log10p |
|---|---|---|---|
| ln3 | -0.01152 | 4.86E-60 | 59.31368 |
| cs3 | 0.009677 | 3.36E-119 | 118.4739 |
| exp | 0.018357 | 0 | 140 |
| #site_m | 0.094099 | 0 | 140 |
| #endo_m | -0.00423 | 2.70E-05 | 4.568619 |
| #site_s | -0.0043 | 5.06E-31 | 30.29572 |
| p_ma | 0.000495 | 0.348526 | 0.457764 |
| e_oe | 0.004469 | 4.56E-37 | 36.34077 |
Table S18. Coefficients and p-values of linear regression with eight factors and factor crossing.
| Feature | Coef | P-value | -log10p |
|---|---|---|---|
| ln3 | -2.83E-06 | 1.22E-05 | 4.915007242 |
| cs3 | -0.015803897 | 1.18E-05 | 4.928955818 |
| exp | -0.001124219 | 0.000303687 | 3.517574008 |
| #site_m | 0.25684395 | 2.13E-29 | 28.67115985 |
| #endo_m | 0.020685808 | 0.026462549 | 1.577368322 |
| #site_s | -0.096087846 | 0.000458275 | 3.338874297 |
| p_ma | -0.019081989 | 0.080483278 | 1.094294345 |
| e_oe | 0.00727338 | 0.000852402 | 3.069355424 |
| ln3:cs3 | 3.94E-07 | 0.490734868 | 0.309153084 |
| ln3:exp | -2.84E-07 | 2.14E-18 | 17.66958993 |
| ln3:#site_m | 1.48E-06 | 0.176921334 | 0.752219795 |
| ln3:#endo_m | 1.84E-06 | 1.44E-16 | 15.84103519 |
| ln3:#site_s | 8.68E-07 | 0.026250076 | 1.580869438 |
| ln3:p_ma | -4.69E-07 | 0.401187569 | 0.396652532 |
| ln3:e_oe | -5.09E-07 | 0.178249045 | 0.748972789 |
| cs3:exp | 7.59E-05 | 0.672276785 | 0.172451885 |
| cs3:#site_m | 0.10223823 | 5.02E-08 | 7.29904158 |
| cs3:#endo_m | -0.027518299 | 0.000143836 | 3.842131652 |
| cs3:#site_s | 0.011775068 | 3.25E-06 | 5.487463689 |
| cs3:p_ma | 0.002299274 | 0.416319908 | 0.380572821 |
| cs3:e_oe | 0.015830659 | 1.05E-10 | 9.977852179 |
| exp:#site_m | 0.00899945 | 1.53E-16 | 15.81588578 |
| exp:#endo_m | 0.000936208 | 0.041409029 | 1.382904954 |
| exp:#site_s | -0.000496407 | 0.002085615 | 2.680765791 |
| exp:p_ma | 0.001429897 | 2.42E-07 | 6.61563286 |
| exp:e_oe | 0.001102657 | 2.24E-12 | 11.64989917 |
| #site_m:#endo_m | -0.221894438 | 5.61E-45 | 44.25103531 |
| #site_m:#site_s | 0.013159268 | 0.402069013 | 0.395699396 |
| #site_m:p_ma | -0.131376751 | 3.87E-10 | 9.412586394 |
| #site_m:e_oe | 0.073734522 | 1.98E-10 | 9.703068939 |
| #endo_m:#site_s | -0.001134625 | 0.84371691 | 0.073803247 |
| #endo_m:p_ma | 0.000400551 | 0.95883541 | 0.018255936 |
| #endo_m:e_oe | -0.008580668 | 0.145104296 | 0.838319728 |
| #site_s:p_ma | 0.119877581 | 5.62E-08 | 7.250318802 |
| #site_s:e_oe | -0.035683116 | 0.027884011 | 1.554644753 |
| p_ma:e_oe | 0.024313262 | 0.024118046 | 1.617657876 |
Table S19. Coefficients and p-values of linear regression with nine factors.
| Feature | Coef | Pvalue | -log10p |
|---|---|---|---|
| ln3 | -0.00641 | 3.80E-20 | 19.42014 |
| cs3 | 0.004361 | 1.15E-25 | 24.93794 |
| exp | 0.018288 | 0 | 140 |
| #site_m | 0.012595 | 1.04E-06 | 5.98222 |
| #endo_m | -0.00441 | 8.56E-06 | 5.06752 |
| #site_s | -0.00574 | 1.47E-55 | 54.83402 |
| p_ma | 0.001759 | 0.000711 | 3.147907 |
| e_oe | 0.004158 | 2.35E-33 | 32.62969 |
| ts_score | 0.076813 | 0 | 140 |
Table S20. Coefficients and p-values of linear regression with nine factors and factor crossing.
| Feature | Coef | Pvalue | -log10p |
|---|---|---|---|
| ln3 | -1.60E-06 | 0.011925824 | 1.923511595 |
| cs3 | -0.008366786 | 0.019318299 | 1.714031125 |
| exp | -0.001568955 | 2.59E-07 | 6.586048885 |
| #site_m | 0.159028884 | 4.01E-10 | 9.396500422 |
| #endo_m | 0.009391765 | 0.304168389 | 0.516885922 |
| #site_s | -0.097095613 | 0.000295034 | 3.530128515 |
| p_ma | -0.012706529 | 0.239896623 | 0.619975865 |
| e_oe | 0.003253876 | 0.128033499 | 0.892676387 |
| ts_score | 0.065575654 | 7.32E-12 | 11.13573822 |
| ln3:cs3 | 9.99E-07 | 0.079045994 | 1.102120133 |
| ln3:exp | -2.48E-07 | 8.53E-15 | 14.06908328 |
| ln3:#site_m | 2.51E-06 | 0.04108057 | 1.386363539 |
| ln3:#endo_m | 7.29E-07 | 0.000920571 | 3.035942721 |
| ln3:#site_s | 7.57E-07 | 0.047937352 | 1.319325957 |
| ln3:p_ma | -2.36E-07 | 0.665962223 | 0.176550406 |
| ln3:e_oe | -1.89E-07 | 0.609903477 | 0.214738891 |
| ln3:ts_score | -9.05E-06 | 8.39E-19 | 18.07603485 |
| cs3:exp | -0.000210957 | 0.234127943 | 0.630546751 |
| cs3:#site_m | 0.063088756 | 0.003621569 | 2.44110321 |
| cs3:#endo_m | -0.030869619 | 1.57E-05 | 4.804938386 |
| cs3:#site_s | 0.011989538 | 1.74E-06 | 5.758989552 |
| cs3:p_ma | -0.000515518 | 0.853673874 | 0.06870801 |
| cs3:e_oe | 0.011256547 | 3.69E-06 | 5.433102786 |
| cs3:ts_score | -0.056098519 | 1.49E-14 | 13.82670741 |
| exp:#site_m | 0.002073852 | 0.075893396 | 1.119796014 |
| exp:#endo_m | 0.001163854 | 0.009384581 | 2.027585129 |
| exp:#site_s | -0.000576086 | 0.000255828 | 3.592052003 |
| exp:p_ma | 0.001497452 | 3.07E-08 | 7.512962288 |
| exp:e_oe | 0.001052792 | 6.52E-12 | 11.18585865 |
| exp:ts_score | 0.008284526 | 3.99E-66 | 65.39935915 |
| #site_m:#endo_m | -0.050965831 | 0.001854836 | 2.731694567 |
| #site_m:#site_s | 0.079648242 | 1.72E-06 | 5.764690568 |
| #site_m:p_ma | -0.182652224 | 8.11E-15 | 14.0911118 |
| #site_m:e_oe | 0.011835961 | 0.335633255 | 0.474135015 |
| #site_m:ts_score | -0.016918648 | 0.320827576 | 0.49372831 |
| #endo_m:#site_s | -0.00650073 | 0.248378993 | 0.604885138 |
| #endo_m:p_ma | 0.003415606 | 0.652117952 | 0.185673844 |
| #endo_m:e_oe | -0.008238802 | 0.151727348 | 0.818936132 |
| #endo_m:ts_score | 0.044847948 | 0.00152743 | 2.8160388 |
| #site_s:p_ma | 0.110263074 | 2.75E-07 | 6.561220289 |
| #site_s:e_oe | -0.027099317 | 0.091634949 | 1.037938855 |
| #site_s:ts_score | -0.035149695 | 8.23E-08 | 7.084730455 |
| p_ma:e_oe | 0.019092069 | 0.073869883 | 1.13153259 |
| p_ma:ts_score | 0.04113798 | 8.56E-07 | 6.067689011 |
| e_oe:ts_score | 0.06617109 | 2.56E-33 | 32.59133846 |
Table S21. P-values of multiple Wilcoxon rank-sum tests on 3 subgroups of CpG frequency.
| Experiment | High | Med | Low |
|---|---|---|---|
| Grimson | 4.84E-27** | 1.60E-05** | 1 |
| Linsley | 1.44E-115** | 0.8724 | 1 |
| Lim | 0.001451** | 0.3292 | 1 |
| Jackson | 4.49E-14** | 0.01002* | 1 |
| Baek | 0.1548 | 0.9116 | 0.283 |
| Selbach | 0.7002 | 0.1597 | 0.8271 |
| Baek MA | 0.005732* | 0.04945* | 1 |
| Selbach MA | 0.001856* | 0.0005601** | 1 |
| Selbach LNA | 0.4183 | 0.6502 | 0.3786 |
| Linsley OME | 5.89E-08** | 0.8315 | 1 |
Lower p-values indicate that a set of genes in one sub-group is more down-regulated than a set of genes in the rest of subgroups. “*” and “**” are added when the p-value is less than 0.05 and Sidak adjusted (n=30) 0.0017, respectively.
Table S22. P-values of multiple Wilcoxon rank-sum tests on 2 subgroups of developmental genes.
| Experiment | Dev | NonDev |
|---|---|---|
| Grimson | 0.9961 | 0.003889* |
| Linsley | 0.9917 | 0.008313* |
| Lim | 0.966 | 0.03401* |
| Jackson | 0.9988 | 0.001185** |
| Baek | 0.05068 | 0.9494 |
| Selbach | 0.09926 | 0.9008 |
| Baek MA | 0.7844 | 0.2156 |
| Selbach MA | 2.74E-05** | 1 |
| Selbach LNA | 0.4256 | 0.5751 |
| Linsley OME | 0.8274 | 0.1726 |
Lower p-values indicate that a set of genes in one sub-group is more down-regulated than a set of genes in the rest of subgroups. “*” and “**” are added when the p-value is less than 0.05 and Sidak adjusted (n=20) 0.0026, respectively.
Table S23. P-values of multiple Wilcoxon rank-sum tests on 2 subgroups of housekeeping genes.
| Experiment | HK | NonHK |
|---|---|---|
| Grimson | 2.93E-06** | 1 |
| Linsley | 1.67E-08** | 1 |
| Lim | 0.0001003** | 0.9999 |
| Jackson | 1.62E-06** | 1 |
| Baek | 0.7208 | 0.2794 |
| Selbach | 0.876 | 0.1241 |
| Baek MA | 0.07838 | 0.9216 |
| Selbach MA | 0.09997 | 0.9 |
| Selbach LNA | 0.1272 | 0.8733 |
| Linsley OME | 0.9771 | 0.02288* |
Lower p-values indicate that a set of genes in one sub-group is more down-regulated than a set of genes in the rest of subgroups. “*” and “**” are added when the p-value is less than 0.05 and Sidak adjusted (n=20) 0.0026, respectively.
Supplementary Figures
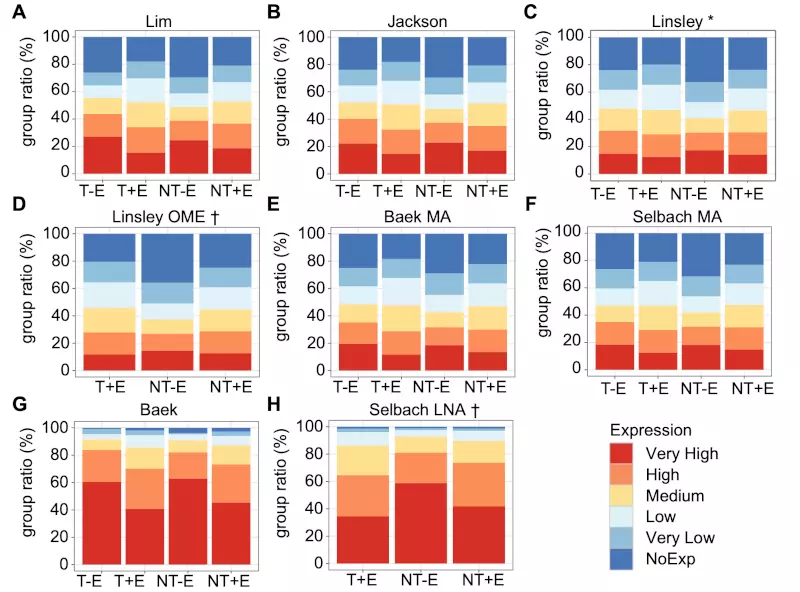
Figure S1. mRNA expression levels from 6 microarray and 2 proteomics experiments.
We calculated the ratios of tag counts of RNASeq for each sub-group relative to the total counts for 6 microarray (A-G) and 2 proteomics (G and H) experiments. The experiment data were divided into four by exogenous miRNA targets (T) and non-targets (NT), as well as endogenous miRNA targets (+E) and non-targets (-E).
* Endogenous miRNAs of the HeLa cells were used to determine if a gene was influenced by any endogenous miRNAs or not (see the Methods). Although some other cell line was used in the Linsley experiment, it is included only for comparison purpose.
† As two inhibition experiments, Selbach LNA and Linsley OME, inhibited endogenous miRNAs in the HeLa cells, there were no genes categorized as T -Endo.
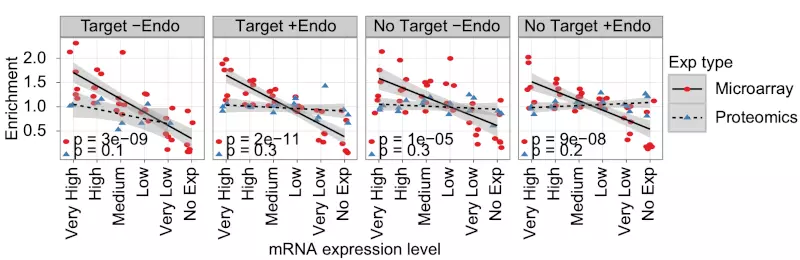
Figure S2. Log2 enrichment of down-regulated genes compared with all genes mRNA.
Scatter plots show log2 enrichment of down-regulated genes compared with all genes for the six sub-groups of mRNA expression levels in all studied datasets subdivided by predicted exogenous and endogenous miRNA targeting. Lines and shaded grays show respectively linear fits and standard errors for the microarray (red dots) and proteomics (blue triangles) experiments; p-values (lower left) are unadjusted p-values from Pearson correlation tests. Data points based on a single gene were excluded. The regression lines show that in the microarray but not the proteomics experiments, down-regulated genes are enriched among highly expressed genes and that this enrichment depends on gene expression levels.
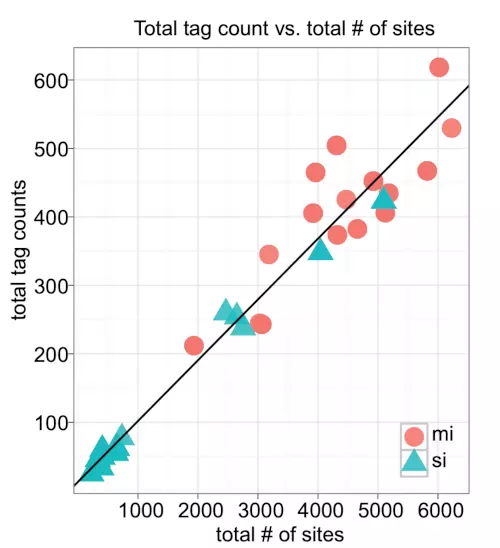
Figure S3. Scatter plot of the total tag counts versus total number of miRNA target sites.
We plotted a scatter plots to check the correlation between mRNA expression level and the number of miRNA target sites. The plot shows the total tag counts and the total number of miRNA target sites from 67 samples with 32 miRNAs and 35 siRNAs. The line was drawn by Pearson’s correlation (r = 0.973 and p 2.2e-16). Only the samples assayed in HeLa were included. Red circles represent miRNAs, whereas blue triangles represent siRNAs.
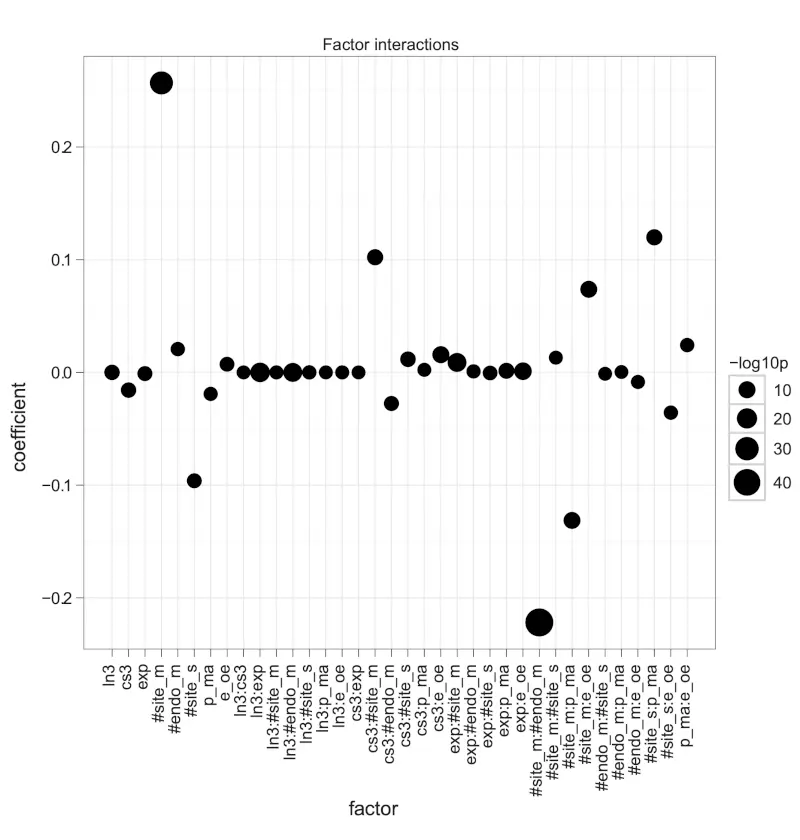
Figure S4. Coefficients of a linear regression with eight factors and factor crossing.
The dot plot shows the coefficients of the liner model with formula: -logratio = (ln3 + cs3 + exp + #site_m + #endo_m + #site_s + p_ma + e_oe)^2. The ^ operator extracts all eight factors as well as all possible combinations of second order interactions, such as ln3 * cs3 (ln3:cs3), ln3 * exp (ln3:exp), and so on. The size of dots indicates -log10p as the negation of the logarithm of p-values to base 10. Positive coefficients associate with miRNA down-regulation.
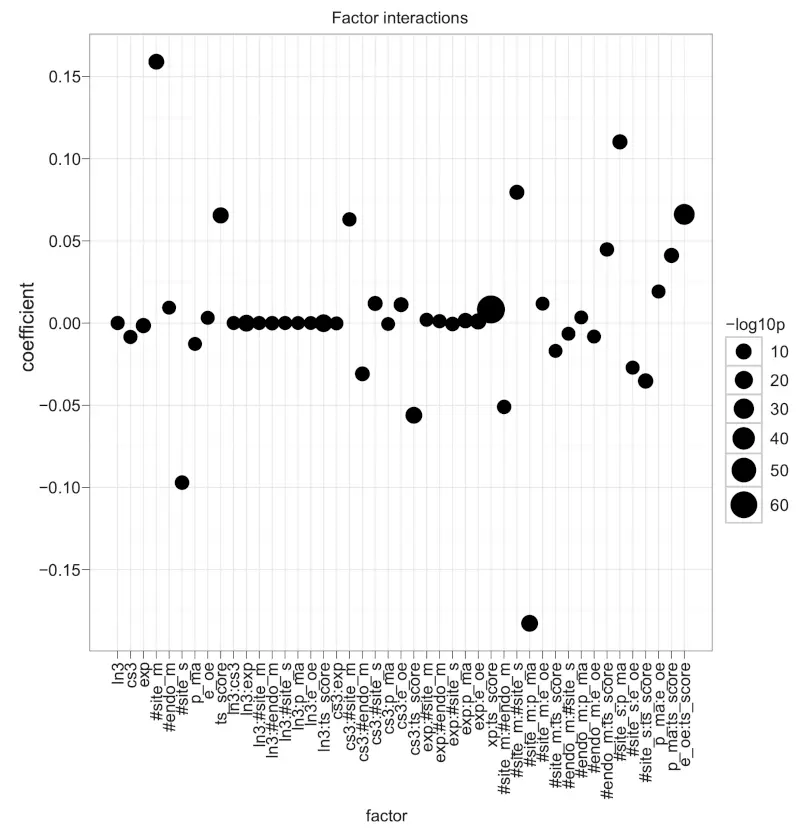
Figure S5. Coefficients of a linear regression with nine factors and factor crossing.
The dot plot shows the coefficients of the liner model with formula: -logratio = (ln3 + cs3 + exp + #site_m + #endo_m + #site_s + p_ma + e_oe + ts_score)^2. The ^ operator extracts all eight factors as well as all possible combinations of second order interactions, such as ln3 * cs3 (ln3:cs3), ln3 * exp (ln3:exp), and so on. The size of dots indicates -log10p as the negation of the logarithm of p-values to base 10. Positive coefficients associate with miRNA down-regulation.